There are excellent blog posts and guides available on Mixture Density Networks, so I will not try to replicate the effort. This post provides a quick summary, and implementation code in the Chainer deep learning framework.
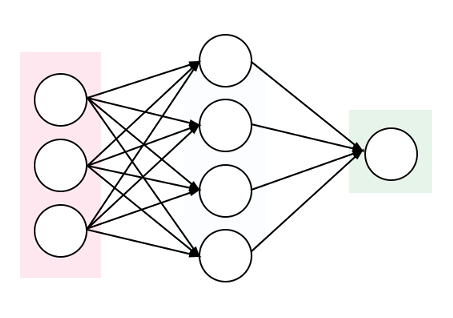
In summary, Mixture Density Networks are Neural Networks that output the parameters of a Mixture Model, such as a Gaussian Mixture Model, instead of the desired output itself. The Mixture Model is then sampled from to get the final output. This is particularly useful when given a certain input, there could be multiple outputs based on some probability.
The outputs from the neural network, in the case of Gaussian Mixture Models, include a set of probabilities [latex]\alpha[/latex] (coefficients), set of means [latex]\mu[/latex], and set of standard deviations [latex]\sigma[/latex]. For example, if output is y given an x, and you choose to have 3 Gaussian mixtures, the output of your neural network would be: [latex]\alpha_1, \alpha_2, \alpha_3, \mu_1, \mu_2, \mu_2, \sigma_1, \sigma_2, \sigma_3[/latex]. The [latex]\alpha[/latex] sum to 1 and represent the probability of each mixture being the likely candidate, and the [latex]\mu[/latex] and [latex]\sigma[/latex] represent the distribution of y within the given mixture and can be used to sample y.
Take as a toy example consider the dataset of (x, y) coordinates represented in the graph below:
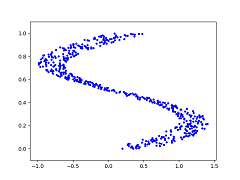
The blue dots represent the desired y value given an x value. So at x=0.25, y could be {0, 0.5, 1} (roughly). In this case, training a neural network using Mean Squared Error to output y directly will cause the network to learn the average of the y values given x as inputs, as shown below (red dots represent y output from the neural network):

For this type of problem, a Mixture Density Network is perfectly suited. If trained properly, and sampled from enough times given all x values in the dataset, the Mixture Density Network produces the following y outputs. It better learns the distribution of the data:

The output of the neural network is simply the number of dimensions in your output (1 in this example), times the number of desired mixtures, times 3 (the coefficient, mean, and standard distribution). In Chainer, a Linear layer can be used to output these numbers.
The loss function is essentially the negative log of the Gaussian equation multiplied by the softmax’d coefficients: [latex]-\ln\{\alpha\frac{1}{\sqrt{2\pi}\sigma}\exp{-\frac{(y-\mu)^2}{2\sigma^2}}\}[/latex], where [latex]\sum\alpha=1[/latex] [1]. This can be represented in Chainer easily as follows:
alpha = F.softmax(alpha)
density = F.sum(
    alpha *
    (1 / (np.sqrt(2 * np.pi) * F.sqrt(var))) *
    F.exp(-0.5 * F.square(y - mu) / var)
    , axis=1)
nll = -F.sum(F.log(density))
Full implementation of a Mixture Density Network in Chainer, for the toy problem shown above, can be found at: https://github.com/AdeelMufti/WorldModels/blob/master/toy/mdn.py
[1] Christopher M. Bishop, Mixture Density Networks (1994)